In course of the progRESsHEAT project an integrated and participatory assessment of policies to enforce the use of renewable and efficient heating and cooling solutions in Europe has been performed. This included a quantitative model based assessment at the local as well as at the national level for each of the municipalities and countries under investigation, and a continuous integration of different stakeholders and policy makers.
The following figure shows the integrated and participatory approach of policy assessment on national and local level in the project progRESsHEAT.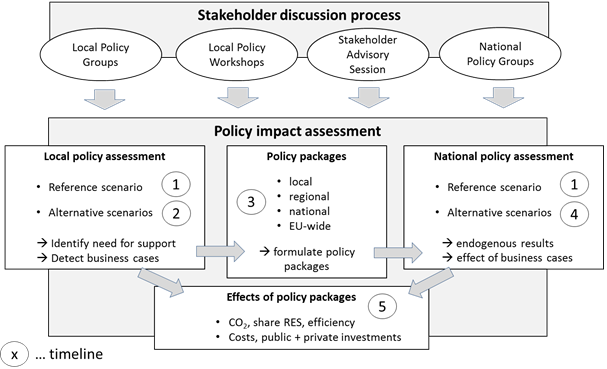
In course of the model based quantitative policy assessment the following steps have been performed:
The definition of relevant policy measures for each of the local and national cases, preliminary results and recommendations drawn from the modelling exercise have been presented and discussed continuously during the 2 ½ years duration of the project. This was done in small policy groups at local and national level and in various workshops at local as well as EU level.
From this assessment of policy impact at local and national levels together with experiences and results from other ongoing and finished research work in Europe we derive recommendations for the design and implementation of policies at local, regional, national and EU level to enforce the use of renewable and efficient heating and cooling solutions. These are compiled in the report “Policy recommendations to decarbonise European heating and cooling systems” .
In the following we will outline the general assumptions in the two policy scenarios. Moreover, we will document the main methodological aspects of the modelling framework and the indicators that were used to assess the effects of the different policy packages on the different sectors related to heating and cooling systems.
In order to assess the influence of policy frameworks on the national heating and cooling systems two scenarios were defined: a current policy scenario reflecting the current state of policy frameworks, and an ambitious policy scenario reflecting more ambitious policy making towards the transition of the heating and cooling systems towards decarbonisation. The table below gives an overview of the general outline of the two policy scenarios as implemented in the quantitative models.
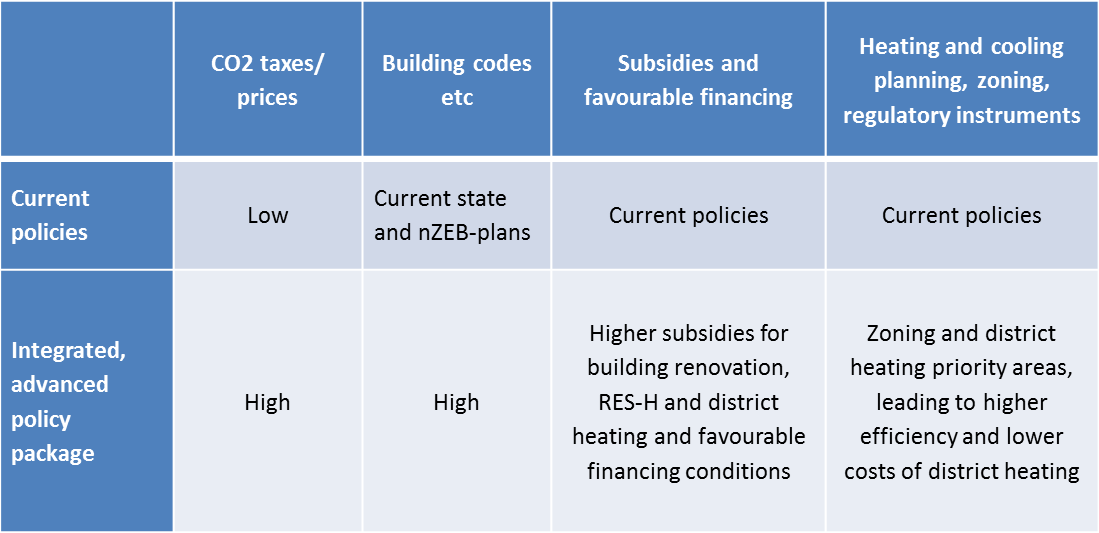
In the current policy scenario in general it is assumed that the policy frameworks are kept at their current state. For penalising CO2 emissions no further action and a not properly functioning EU-ETS is assumed resulting in low prices for CO2 staying at the 2015 level of 7,5 EUR/tCO2 for all sectors until 2050. Building codes in this scenario reflect currently implemented building codes and nZEB-plans in the different countries. For industrial facilities the EU Ecodesign directive for energy using products is assumed to stay in its current form and the energy taxes as reported by Eurostat in 2015 will not change. Subsidies and financing conditions for industry and buildings reflect currently available support available in the different countries, and regulatory instruments as well as heating and cooling planning is not changing its current form. For investments in district heating infrastructure and plants for electricity generation financing is calculated with an interest rate of 4%.
In the ambitious policy scenario integrated and advanced policy packages are assumed to be integrated in all countries and at EU-level. This includes a rising CO2 price level according to the PRIMES reference projection for all sectors. Additionally a strong political commitment to these rising prices is given, which let investors consider the CO2 price 10 years ahead for their investment and ensuring secure conditions. Building codes in this scenario include obligatory shares of renewable supply for new buildings from 2020 on, and also for major renovations beginning in 2030. On the other hand higher subsidies for building renovation and renewable heating and district heating are available compared to the current levels or subsidies made available, if these are not currently in place. Advanced policy frameworks in industry include increased subsidies as well as support of the running costs for RES-H and efficient technologies, the inclusion of all industrial activities in the EU ETS system, the exploitation of industrial excess heat potentials and a comprehensive support of material efficiency and circular economy. Investments in district heating infrastructure and plants for electricity generation are assumed to be possible at an interest rate of 0% due to improved financing conditions.
The scenarios described above are modelled with a framework of three models as shown in the figure below:
The figure below shows an overview of the use of the different models and their linkages as used for the analysis in course of this assessment exercise.
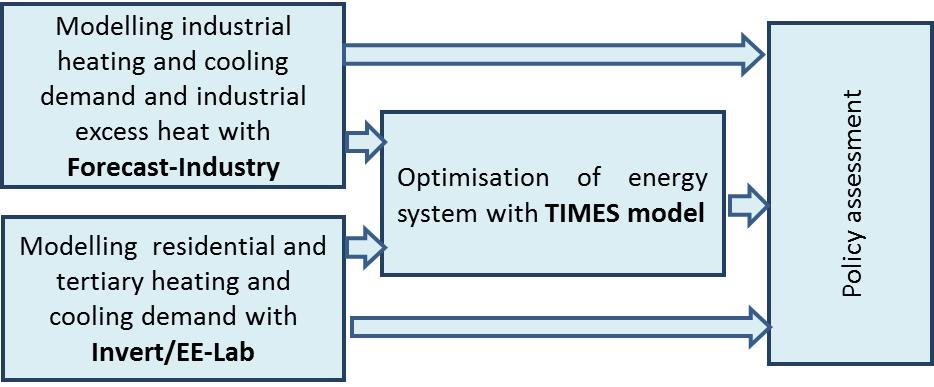
In a first step the developments of the energy demand by energy carriers in buildings and industry as well as excess heat potentials are simulated with the Invert/EE-Lab and FORECAST-Industry model, respectively. For buildings the demand for energy carriers related to space heating, space cooling and hot water preparation is calculated, for industry the demand for energy carriers for all uses in the production facilities is calculated. Then the energy demand developments for district heat in these sectors as well as the excess heat potentials from industrial activity are fed into the TIMES model, which optimises the supply mix for district heat and electricity in a subsequent step. The development of the electricity demand is taken from the PRIMES reference scenario 2016 . This is done for each of the two policy scenarios in each of the countries.
The model Invert/EE-Lab is a bottom-up building stock simulation model covering EU-28 countries. It is a dynamic bottom-up model, which is designed to simulate scenarios and thereby compute future trends of the energy demand for space heating, cooling and hot water in the residential and service sector at a national and regional level under different framework conditions like energy consumer prices, stock developments and policies related to heating and cooling in buildings.
The basic idea of the model is to describe and simulate developments in the building stock and the related heating, cooling and hot water systems on a highly disaggregated level. The model calculates energy needs and delivered energy, determines reinvestment cycles and new investments in building components and heating and cooling technologies and simulates the decisions of various agents (i.e. owner types) in case that an investment decision is due for a specific building component or technology in a specific part of the building stock. The core of the simulation model is a nested logit approach in order to calculate market shares of heating systems and energy efficiency measures depending on building and investor type. In this the objectives of agents under imperfect information conditions are optimised, thereby also considering diffusion restrictions in the change of technologies. Input data for the base year and results from the model are split up by energy carrier. A detailed description of the Invert/EE-Lab model and further information on the model and related previous projects can be found at the website of the Invert/EE-Lab model
The FORECAST modelling platform aims to develop long-term scenarios for future energy demand. It is based on a bottom-up modelling approach considering the dynamics of technologies and socio-economic drivers. The model allows addressing research questions related to energy demand including scenarios for the future demand of individual energy carriers like electricity or natural gas, calculating energy saving potentials and the impact on greenhouse gas (GHG) emissions as well as abatement cost curves and ex-ante policy impact assessments. www.forecast-model.eu
TIMES models are linear programming models that consist of minimization of the objective function defined as a mathematical expression of decision variables, subject to mathematical constraints. In other words, TIMES models optimize the investments, operation, primary energy supply and imports/exports across all implemented regions and for all time periods in an energy system, minimizing the objective function. The objective function in TIMES models represent the total system costs discounted to a reference year.
TIMES models are multi-regional, technology-rich, bottom-up models used for long-term analysis and planning of regional, national and multi-national energy systems . In addition to that, TIMES models are a techno-economic, partial equilibrium models assuming full foresight and perfectly competitive markets. Thus, they are well suited for incorporating "4E" foundations of energy systems – energy, economy, environment and engineering. TIMES is usually used for simultaneous analysis of the whole energy system (power and heating, industrial, transportation, residential sector, etc.), but can be also used for analysis of specific sectors. The outputs from the model include region and time-specific investment, operation and import/export levels optimal for the energy system as a whole. In addition to that, the costs, environmental indicators, prices of commodities, etc. are obtained alongside the optimal solution. The Integrated MARKAL-EFOM System (TIMES) model generator is developed and maintained by the Energy Technology Systems Analysis Programme (ETSAP) , a Technology Collaborative Programme of the International Energy Agency (IEA), established in 1976. The TIMES model generator source code, written in GAMS, is open and available for download to anyone free of charge upon signing the ETSAP Letter of Agreement on www.iea-etsap.org.
The calculations in this analysis for the building sector include buildings from the residential and the tertiary sector (services). Industrial buildings, however, are not included in the building sector calculations. The energy demand, resulting emissions and costs are related to space heating, space cooling as well as hot water preparation. In contrast, the use of appliances in buildings and its effects on energy demand, emissions and costs are not included. Thus, the indicators and figures for the building sector in this analysis reflect the entire and solely the H/C part in this sector.
CO2 emissions:
The CO2 emissions shown for the building sector only take into account direct emissions generated in the buildings. Thus, main emission sources are fossil fuels used in boilers in the buildings. Emissions from the generation of electricity and district heat, which is used in the buildings for H/C purposes, are counted in the emissions of the district heating and power sectors. Therefore, the emissions resulting from electricity use in cooling devices in the buildings is also not included in the building sector, but in the emissions of the power sector.
Final energy demand:
Final energy demand in the building sector as indicated in this analysis comprises all energy carriers used in the buildings for H/C purposes. This includes energy carriers used in boilers, the electricity used in direct heaters and heat pumps, the solar thermal energy fed into the heat distribution systems, the ambient heat that is used in heat pumps and the district heat that is fed into the transfer stations.
Share of renewable energy sources (RES):
The share of renewable energy sources (RES) for the building sector is calculated similar to Eurostat definition as the share of RES on the final energy demand for H/C. This includes the share of RES in the generation of DH, but does not include the share of RES on the electricity generation. This is mainly due to the fact that DH is mainly consumed in the buildings, while electricity used for H/C purposes in buildings is only a minor share of the overall national electricity demands.
Investment and running costs:
The costs for the provision of H/C in the buildings in this analysis comprises of investment costs, operation and maintenance costs and fuel costs for devices generating space heating and hot water. The devices providing space cooling (i.e. air conditioning systems) are not included in this indicator.
Programme costs:
For the building sector also the annual costs of funding programmes are provided. The indicator of programme costs hereby includes funding schemes for technologies using renewable energy sources (also including heat pumps), as well as funding schemes for subsidising the retrofit of existing buildings and for subsidising the additional costs of constructing new buildings at heat demands lower than stated in the national building codes.
The industry sector is defined according to the Eurostat energy balances as final energy. Thus, energy demand is calibrated to Eurostat 2012 final energy. According to the definition of final energy demand, the petrochemical/refinery industry is not part of the industrial sector and not included in this analysis.
GHG emissions:
Energy related GHG emissions are calculated based on final energy demand. Only direct emissions are accounted for, thus, emissions from electricity and district heat use are not accounted in industry, but in the combined "district heating and power generation sector". Further, emissions from chemical processes (not related to energy conversion) are accounted for. Major sources of processes emissions are clinker, adipic acid, nitric acid and ammonia production, but also some minor sources like glass and aluminium production are included. Note that the emissions balance shows substantial differences compared to the UNFCCC accounting of industrial emissions.
Final energy demand:
Defined as in Eurostat, final energy demand of the manufacturing industry (excluding refineries).
Share of renewable energy sources (RES):
The share of RES is calculated similar to Eurostat definition (SHARES project): Sum of all renewable energy carriers divided by the sum of total final energy demand excluding electricity. Shares of district heating or electricity produced by RES are not accounted for.
The district heating and power sector are responsible for production of electricity and district heating in Small and Large district heating areas. The fuel input to power and district heating sector, CO2 emissions from the sector and total costs of electricity and district heating sector are the outputs from TIMES models. The RES is calculated based on the fuel input.
CO2 emissions:
The CO2 emissions from electricity-only and DH-only plants and CHPs is the output from TIMES models. For electricity-only and DH only plants, the CO2 emissions are allocated entirely to electricity and DH, respectively. For CHPs, CO2 emissions are allocated proportionally to fuel input, while the fuel input is allocated according to fixed-heat-efficiency approach.
It is assumed that combustion of fossil fuels and waste result in CO2 emissions. Biomass is assumed carbon-neutral, i.e. the CO2 emissions for combustion of biomass are not accounted.
Primary energy demand:
The fuel input to electricity-only and DH-only plants and CHPs is the output from TIMES models. For electricity-only and DH only plants, the fuel input is allocated entirely to electricity and DH, respectively. Fixed-heat-efficiency approach is used to allocate fuel input to CHPs into fuel input to electricity and fuel input to DH production. In this approach, the efficiency of heat generation is fixed to allocate the fuel input to DH production. The fuel input to electricity production is calculated as a residual from the total input. The standard heat efficiency was set to that of a typical heat boiler to 90%
Hydro, wind, solar (PV and solar heating) and wave are presented as inputs to electricity and DH production. It should be noted that the processes converting these inputs into electricity and DH have the efficiency of 1, i.e. the fuel input is equal to electricity or DH at the output of the plants.
Share of renewable energy sources (RES):
Renewable energy share (RES) is calculated from the fuel input as a share of renewable energy in the total energy mix. RES is first calculated for electricity and after that for DH, because electricity can be input to DH production (electric boilers and large-scale heat pumps). Fossil and nuclear fuels are considered non-renewable, while other energy carriers (biomass, solar, wind, geothermal, wave, etc.) are considered renewable. Waste is accounted as renewable energy carrier.
Total Costs:
The costs of the power and DH system divided into variable O&M, fixed O&M, fuel costs, electricity import costs and earnings from electricity export and investment costs for each year of the analysed period and are outputs from the national TIMES models.
Apart from the indicators for the assessment of policies in the different sectors (buildings, industry as well as DH and electricity generation) as described above, we also display indicators comparing all sectors in the countries related to heating and cooling. These are described in the following.
CO2 emissions:
The overall CO2 emissions comprise the direct emissions from the buildings and the industry sector, the emissions from the district heating sector and the emissions of the power sector originating from electricity used for heating and cooling.
Primary energy demand:
The reflected energy demand in this indicator comprises the fuel demand for heating and cooling from the buildings and industry sector (excluding electricity and district heating) plus the primary energy input into the district heating sector plus the primary energy input into the power sector for electricity used for heating and cooling purposes.
Share of renewable energy sources (RES):
For the buildings and industry sector this share is calculated excluding electricity both in the overall demand for heating and cooling and in the amount of renewable energy used to generate electricity. The share of renewable energy in district heating, however, is taken into account in the calculation of the share of RES in industry and buildings. The share of RES in DH generation takes into account all energy carriers used in DH generation. The same applies to the calculation of the share of RES in electricity generation.